In this article, you will learn how to navigate and utilize the financial reports dashboard to monitor your business’s financial health.
1Understanding your financials is crucial for scaling your business and maintaining a healthy cash flow. The financial subgroup houses five distinct reports designed to give you complete operational visibility, allowing you to track billing, collections, profitability, outstanding receivables, and tax liabilities seamlessly.
Accessing the Financial Subgroup
In order to view your financial data, you will need to access your reports dashboard from the main navigation interface.
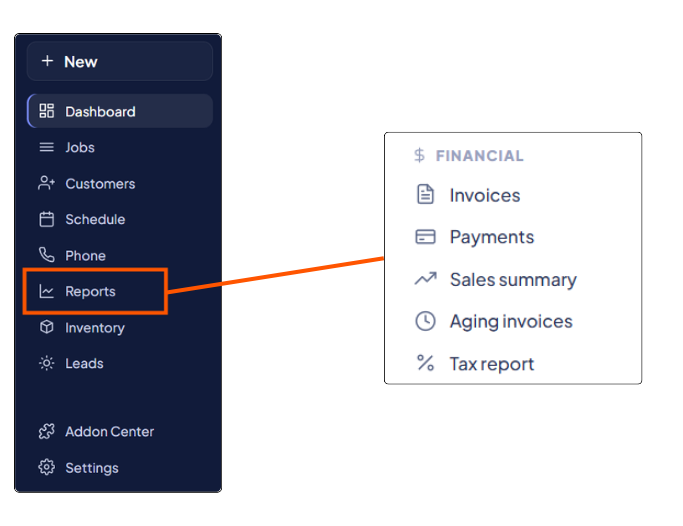
1. Navigate to Reports:
Click on Reports located on your left-hand sidebar to open the financial subgroup.
2. Review Invoices:
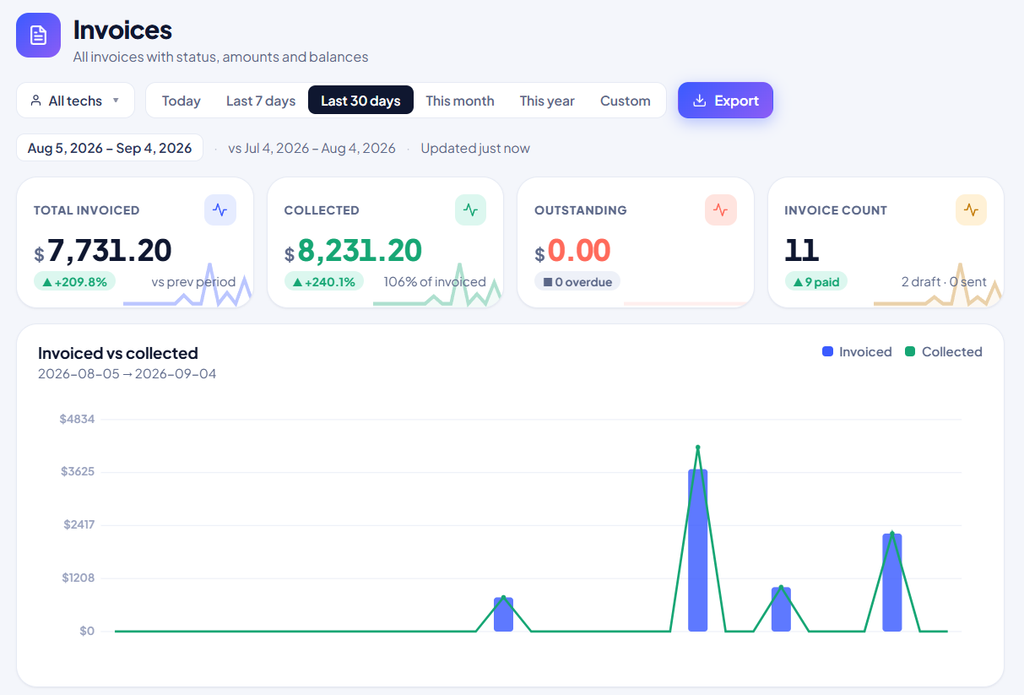
Select Invoices to view billing health, filter data, and analyze graphs.
- Use the technician drop-down to filter by specific team members.
- Utilize quick date range selectors to change timeframes (e.g., Last 30 Days).
- Click the prominent Export button to take your raw data offline, or use the quick buttons to print or share records with an accountant.
3. Analyze Payments:
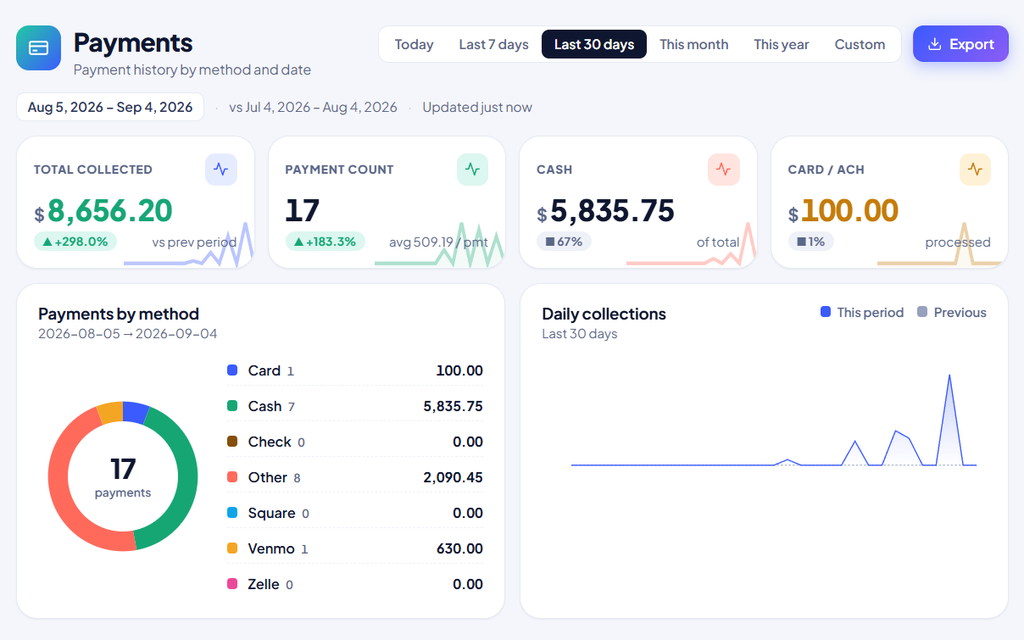
Click into Payments to track the revenue that has successfully entered your business.
- Monitor KPI cards for total collected and payment count, breaking down transactions by cash, card, or ACH.
- View the Payments by Method donut chart and the Daily Collections line graph to track cash flow momentum.
- Filter the raw data table using specific payment method tabs to reconcile batches or daily deposits.
4. Evaluate Sales Summary:
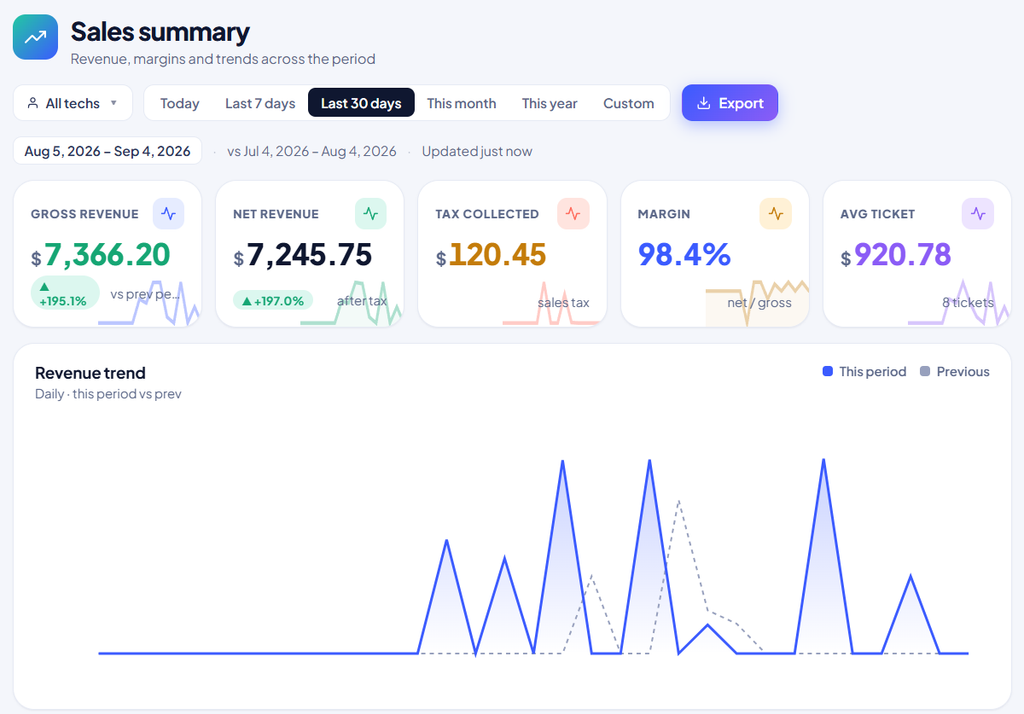
Select Sales Summary to check overall profitability metrics.
- Review top KPI cards for gross revenue, net revenue after tax, tax collected, overall profit margin, and average ticket size.
- Utilize the service category breakdown in the lower data table to identify which specific services drive the most revenue.
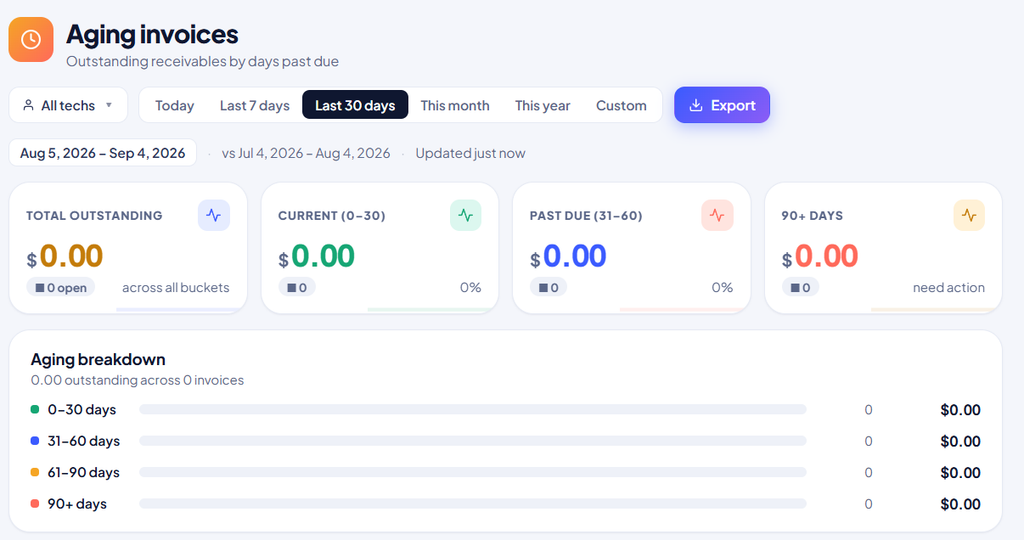
5. Track Aging Invoices:
Click into Aging Invoices to review outstanding receivables categorized into automated time buckets.
- Check KPI cards and the horizontal bar chart for balances sitting in 0 to 30 Days, 31 to 60 Days, and 90+ Days.
- Look for overdue balances highlighted in bold red text in the detailed table to execute targeted follow-ups.
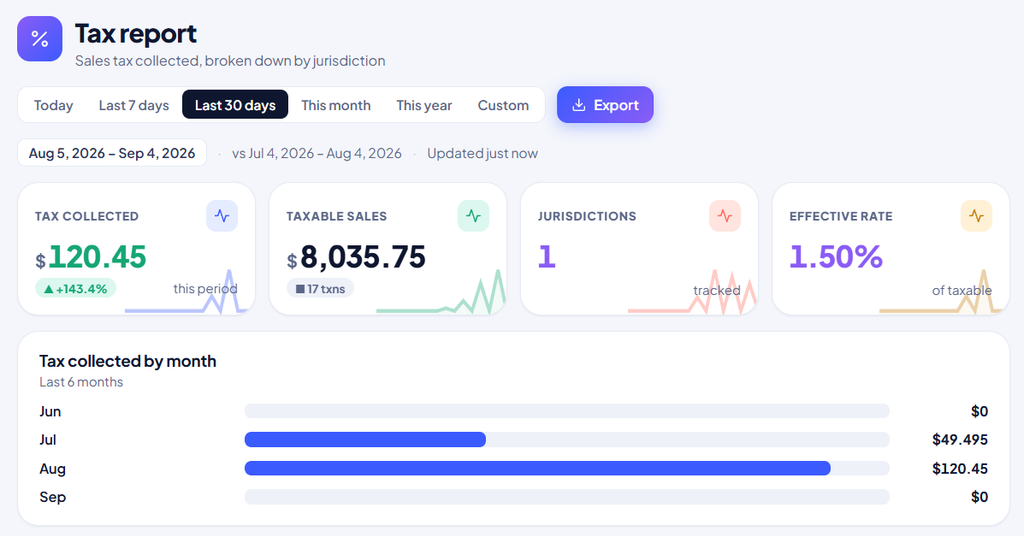
6. Check the Tax Report:
Select the Tax Report to view systemwide compliance data and current liabilities.
- Review total tax collected, total taxable sales, tracked jurisdictions, and your overall effective tax rate.
- Review the data table to see collections broken down automatically by specific tax jurisdictions.
These integrated reporting views provide the actionable insights and clarity needed to effectively manage and scale your business operations.